Research
Turbulent gas-liquid flows and boundary layers
This section is currently under construction. Please go the Computational Modeling of Energy Systems (CMES) page (soon to be CTFL - Computational Thermofluids Laboratory) to see what our group's research consists of.
Visualization-Driven Analysis and Comparison of Taylor-Green and ABC Flows

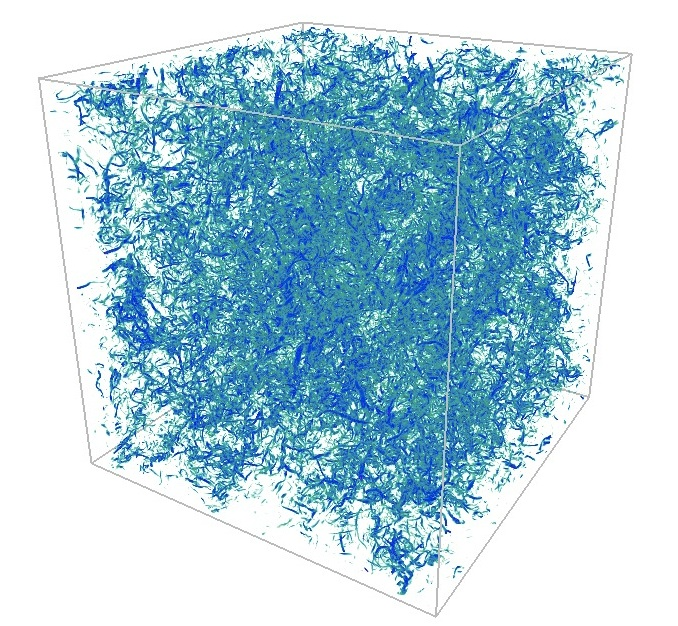
Post-processing and data analysis becomes increasingly difficult as data volumes become larger and larger. As we are approaching the petascale, the user’s ability to interact with the data becomes limited. VAPOR1 is a visualization and analysis tool that allows for the user to interact with the data via region-of-interest extraction and structure identification. Although VAPOR is used routinely by international scientists, it has recently been augmented to allow for combined-component analysis. Combining iterative refinement, geometry, and topology, VAPOR will allow us to look at the statistics of both local and global flow structures. In data from a 10243 simulation of forced turbulence, this tool lead to the discovery of two distinct vortical structure populations that would have otherwise been extremely difficult if not impossible to identify2. Having access to 10243 data sets of both Taylor-Green and ABC flows produced by Pablo Mininni3, our goal is to use VAPOR to look at the statistics of vorticity and helicity for the two flows as a function of how we define these parameters. This is done by setting a threshold of vorticity and helicity within VAPOR for which structures (or regions) of the flow will be extracted. We will then compare the results from the two flows. The image to the right illustrates the ability of VAPOR to isolate structures based on a certain threshold defined by the user.
2 K. Gruchalla, M. Rast, E. Bradley, J. Clyne and P. Mininni, Visualization-Driven Structural and Statistical Analysis of Turbulent Flows, 2009.
3Departamento de Física, Facultad de Ciencias Exactas y Naturales, Universidad de Buenos Aires, Argentina and Geophysical Turbulence Program, National Center for Atmospheric Research, Boulder, Colorado